
Building Lightweight Applications with a Spreadsheet-Backed Architecture
Table of Contents
Not every internal product needs a full database, admin panel, queue system, and custom back office on day one. For early-stage applications, a spreadsheet can be a practical operational data layer when it is combined with a thin API and a focused frontend.
This pattern is useful when the goal is to build a real application quickly while keeping the data model visible, editable, and easy to evolve. It is especially practical for early mobile app development projects where teams need a working product experience before the backend model is fully settled. The spreadsheet is not just a file in this setup. It becomes the back-office interface, the API becomes the application boundary, and the frontend becomes the product experience.
This architecture uses three simple layers:
- Spreadsheet
- Serverless API
- Mobile or web frontend
The spreadsheet acts as the editable data store. The API turns spreadsheet rows into stable JSON responses. The frontend focuses only on presentation, interaction, filtering, and data entry.
The result is not a replacement for a production-grade database. It is a pragmatic application architecture for fast iteration, human-readable data, and small-team workflows where business logic is still evolving.
Core Idea
The spreadsheet is treated as the system of record for structured operational data.
Each worksheet represents a domain table:
- Primary records: Stores the main entities that the application displays or acts on.
- Reference data: Stores metadata, categories, display names, mappings, and lookup values.
- State snapshots: Stores the latest calculated state for each entity, such as status, owner, priority, or derived metrics.
- Activity log: Stores append-only user actions, changes, submissions, notes, and workflow events.
The API reads these sheets, normalizes each row into typed JSON, and exposes action-based endpoints for the frontend.
The frontend does not need to understand spreadsheet layouts. It only consumes API contracts such as:
GETa list viewGETa detailed recordGETsearch or autocomplete resultsGETrecent activityPOSTa new workflow event
This separation is important. The spreadsheet can remain flexible for analysts, while the frontend receives predictable data structures.
Why Use a Spreadsheet as the Data Layer?
A spreadsheet is useful when the data model is still changing frequently.
It allows non-developers or semi-technical users to:
- Edit records
- Add new columns
- Inspect formulas
- Adjust thresholds
- Review raw data
- Manually correct edge cases
- Export and audit data
This is especially useful for workflow tools, dashboards, scoring interfaces, lightweight CRMs, editorial systems, reporting apps, and internal operations products where the data model is not final. During early iterations, the ability to inspect and change the logic quickly is often more valuable than strict database normalization.
The trade-off is that the spreadsheet should not be treated as an infinitely scalable backend. It is best suited for moderate datasets, internal usage, and workflows where transparency matters more than throughput.
Good Use Cases
This architecture works best when the application needs to become useful quickly, the data model is still evolving, and the team benefits from a human-editable operational layer.
Good use cases include:
- Internal dashboards: Teams need a fast interface over operational data, but the data still changes frequently.
- Approval workflows: Rows can represent submissions, statuses, reviewers, comments, and timestamps.
- Lightweight CRM tools: Leads, contacts, pipeline stages, notes, and follow-up dates can live in sheets while the frontend provides a cleaner workflow.
- Editorial and publishing workflows: Content plans, drafts, categories, review status, and publish dates can be managed in a spreadsheet and surfaced through an app.
- Inventory and asset tracking: Small teams can track items, quantities, owners, locations, and status without building a full admin system.
- Research and scoring tools: Analysts can adjust formulas, add criteria, and review model outputs while users consume normalized results through the app.
- Field operations apps: Mobile users can submit structured updates while the operations team reviews and corrects data in the spreadsheet.
- Reporting portals: A spreadsheet can collect manually curated metrics, while the frontend turns them into a controlled presentation layer.
- Prototype admin panels: The spreadsheet acts as the first admin interface until the product justifies a dedicated back office.
The common pattern is simple: the spreadsheet is where data is reviewed and corrected; the API is where data becomes reliable for software; the frontend is where users complete the workflow.
Poor Use Cases
This architecture is not a good fit for every product.
It should be avoided when the application requires:
- High-frequency writes
- Thousands of concurrent users
- Strict transactional guarantees
- Complex joins across large datasets
- Low-latency real-time collaboration
- Fine-grained database permissions
- Regulatory-grade audit requirements
- Large event histories
- Heavy analytics queries
In those cases, a real database should be introduced earlier. The spreadsheet can still remain useful as an import source, review surface, or admin-friendly override layer, but it should not be the primary runtime database.
API Layer
The API layer is intentionally thin.
Its responsibilities are:
- Authenticate requests
- Read rows from specific worksheets
- Normalize identifiers, dates, enums, and numeric values
- Convert spreadsheet rows into JSON objects
- Calculate derived business or decision metrics
- Expose read endpoints for the frontend
- Append user-generated events to the relevant log table
- Return consistent error payloads
The API avoids exposing raw spreadsheet rows directly. Instead, it maps spreadsheet columns into domain objects.
For example, a spreadsheet row may become:
{
  "id": "record_123",
  "title": "Example Record",
  "status": "review_required",
  "priority": 79,
  "confidence": 0.85,
  "updatedAt": "2026-05-26T10:30:00Z",
  "reasons": [
    "Incomplete supporting data",
    "Manual review required"
  ]
}
This keeps the frontend stable even when spreadsheet formulas or helper columns change.
Latency and Data Freshness
Spreadsheet-backed systems usually feel slightly slower than database-backed APIs. This is expected. The request path includes the frontend, the serverless runtime, spreadsheet access, row parsing, normalization, and JSON serialization.
There are two different delays to measure:
- API response latency: How long it takes the frontend to receive a response after it sends a request.
- Data freshness latency: How long it takes a spreadsheet change to become visible in the application.
In a small control test against the serverless endpoint, 20 requests returned this response-time profile:
- Minimum: 766 ms
- Median: 1,089 ms
- P95: 1,495 ms
- Maximum: 1,818 ms
This was a lightweight endpoint reachability test, not a full authenticated spreadsheet read. Endpoints that read and transform spreadsheet rows can be slower, especially when they scan multiple worksheets or when the serverless runtime starts cold.
In practical terms, the user experience should assume that data may appear with a short delay:
- Warm API request: Often around 1-2 seconds.
- Initial screen load: Can be longer if multiple requests run sequentially.
- Spreadsheet edit visibility: Usually near real time, but should be treated as eventual rather than instant.
The frontend should make this behavior explicit through loading states, pull-to-refresh, and a visible updatedAt timestamp. Without that timestamp, users may not know whether they are looking at fresh data or the previous response.
For the first screen, request ordering also matters. If the frontend loads a detail record first and then loads the main list, the visible list may appear later than expected. When possible, independent startup requests should be executed in parallel:
- Load the main list
- Load the selected detail record
- Load recent activity or summary state
Running these calls concurrently reduces perceived startup delay because the screen waits for the slowest request rather than the sum of all requests.
For stronger freshness guarantees, the system can add:
updatedAtfrom the API responsesourceUpdatedAtfrom the spreadsheet row- Domain-specific update timestamps, such as
contentUpdatedAt,priceUpdatedAt, orstatusUpdatedAt - Calculation-specific timestamps, such as
scoreUpdatedAt,priorityUpdatedAt, ormodelUpdatedAt - Manual refresh in the UI
- Short-lived response caching only where safe
- Background refresh after first render
The important design principle is to treat spreadsheet-backed data as read-on-demand and eventually fresh. It is suitable for lightweight application workflows, but the interface should not imply millisecond-level real-time behavior.
Live Refresh Experience
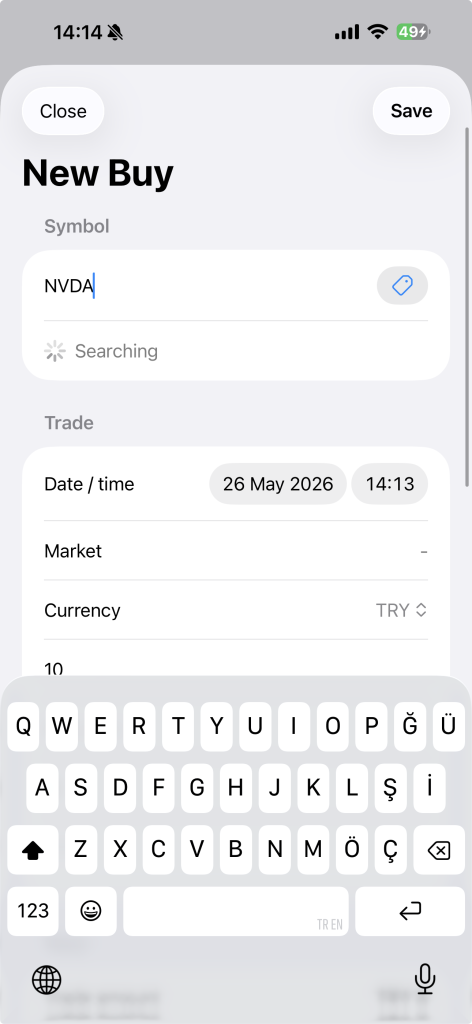
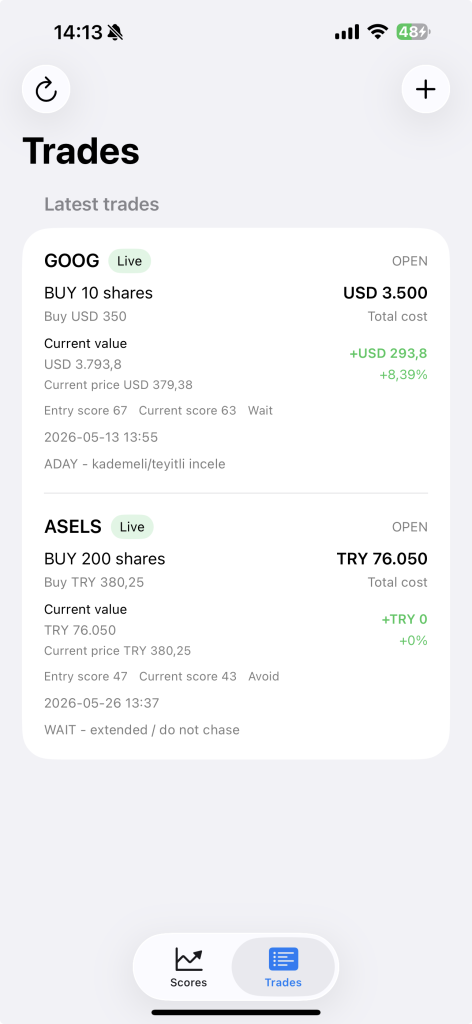
This architecture was tested in a finance-focused mobile application where users could review calculated records, record a transaction, and then expect the updated activity list to appear in the app.
The first important finding was that a spreadsheet-backed serverless API should not be treated like a true realtime stream. It works well for read-on-demand screens, but it does not naturally behave like WebSocket, Firestore listeners, Supabase realtime, or a dedicated event stream.
For this type of application, a lightweight live refresh model worked better:
- Load fresh data when the app opens.
- Refresh when the user returns to the foreground.
- Refresh when the user changes tabs.
- Refresh immediately after a successful write.
- Poll active screens every 10-30 seconds when freshness matters.
- Keep pull-to-refresh as a manual fallback.
In the finance test case, a newly recorded transaction was written to the spreadsheet successfully and then became visible through the API. The main issue was not whether the write worked; it did. The issue was how quickly and clearly the user saw the result.
The practical experience was:
- A successful write should update the local UI immediately.
- The API should then be called again to confirm the server-side state.
- The activity list should refresh automatically while the user is looking at it.
- The screen should show timestamps so the user knows how fresh the data is.
- True realtime behavior should not be promised unless the backend includes a realtime transport.
This gives users a “live enough” experience without adding unnecessary infrastructure. For spreadsheet-backed tools, polling is usually a better first step than introducing WebSockets or a realtime database too early.
The trade-off is clear:
- Polling: Simple, reliable, good enough for many internal and operational apps.
- Realtime streaming: Better for collaborative or high-frequency experiences, but requires a different backend architecture.
For finance-oriented screens, the right interval depends on the workflow. A trade or activity screen may refresh every 10-15 seconds while open. A dashboard or scoring screen may refresh less frequently, or only when the user opens it.
Action-Based Endpoints
For a small internal service, action-based endpoints are often enough.
Typical actions include:
- health: Checks whether the API is available.
- list: Returns the main list view for the application.
- search: Returns autocomplete or lookup results.
- detail: Returns the full detail view for one record.
- state: Returns the latest calculated state for one record.
- activity: Returns recent workflow or audit events.
- createEvent: Appends a new user action or workflow event.
This is not a pure REST design, but it is simple, explicit, and easy to operate. For a lightweight serverless API backed by a spreadsheet, that simplicity is an advantage.
Raw Data and Actionable Views Are Different Concepts
One of the most important design decisions is separating raw operational data from the view that users actually act on.
Raw data answers:
What does the spreadsheet currently contain?
The actionable view answers:
What should the application show, prioritize, hide, warn about, or ask the user to review?
Those are not the same thing. A row can be technically valid but still be incomplete, stale, risky to act on, or not ready for the primary workflow.
The API is the right place to make that distinction. It can preserve the original row values while also adding derived fields such as:
- Normalized status
- Display priority
- Confidence level
- Validation warnings
- Review requirements
- User-facing labels
- Last-updated timestamps
This keeps spreadsheet flexibility without pushing raw spreadsheet complexity into the frontend.
Workflow States
The frontend should not force users to interpret raw fields alone.
The API can convert spreadsheet values and business rules into workflow states:
- Ready: The record is complete enough for the primary action.
- Needs review: The record is useful, but some data requires manual confirmation.
- Waiting: The record is valid but not actionable yet.
- Blocked: The record cannot move forward until a required condition is fixed.
- Archived: The record is no longer part of the active workflow.
These labels should be domain-neutral at the API design level, even if the application later maps them to domain-specific UI copy.
For example:
- Raw row status:
complete - Confidence: 0.85
- Workflow state:
needs_review - Reason: Supporting data is present, but a manual check is still required.
That is more useful than showing a raw spreadsheet value and leaving the user to infer what it means.
Explainability Metadata
Short explanation labels can make a lightweight application feel much more trustworthy.
Examples:
- Missing required field
- Data recently updated
- Manual review required
- External source unavailable
- Derived value adjusted
- Low confidence
- Ready for approval
- Waiting for owner input
These labels make business rules visible without turning the interface into a long report.
They also reduce ambiguity. For example, a confidence value should map to clear user-facing language:
- 90-100%: Strong
- 75-89%: Sufficient
- 60-74%: Partial
- 0-59%: Low
Small language choices matter because users build trust through consistency.
Normalized Display Values
When data comes from spreadsheets, the same value may appear in multiple formats: dates, currencies, percentages, names, IDs, statuses, and decimal separators can all vary.
The API should normalize these values before the frontend receives them. A good response can include both the machine-friendly value and the display-friendly value:
{
  "amount": 184.35,
  "currency": "USD",
  "amountDisplay": "$184.35"
}
This allows the frontend to display clean values without reimplementing parsing rules.
The same source of truth should be used across list views, detail views, and activity screens. If one screen uses one source and another screen calculates from a different source, users will quickly lose confidence.
Append-Only Event Logging
For workflows that include user actions, it is better to log events than to overwrite history.
Instead of only storing the latest state, the application can append events such as:
- Record created
- Status changed
- Note added
- Review requested
- Approval submitted
- Owner changed
- Value manually overridden
- External sync completed
- Error recorded
This creates an operational history that can be audited later.
Over time, the event log can answer questions such as:
- Which workflow states create the most delay?
- Which records require the most manual review?
- How often do users override calculated values?
- Where do errors or incomplete records usually appear?
Frontend Responsibilities
The frontend should remain a focused interface layer.
Its responsibilities are:
- Render list views
- Show detail records
- Search records
- Open detail sheets
- Record workflow events
- Display current state, history, and derived values
- Show explanation labels and workflow states
- Refresh data on app launch and user action
- Handle loading, empty, and error states
The frontend should not duplicate business rules. It should display the API’s normalized outputs.
This keeps the model centralized and prevents multiple versions of the same logic from drifting apart.
Strengths of This Architecture
This model is effective when:
- The data model changes often
- The team wants fast iteration
- The dataset is moderate
- Manual review is part of the workflow
- Transparency matters
- The frontend needs to be simple and fast
- The backend should be inexpensive to operate
It is especially useful for MVPs, internal tools, scoring systems, editorial workflows, monitoring dashboards, and workflow journals.
Limitations
The model has clear limits.
A spreadsheet-backed system is not ideal for:
- High request volume
- Large datasets
- Complex relational queries
- Strict transaction guarantees
- Multi-user write conflicts
- Low-latency real-time updates
- Advanced permission models
- Regulatory-grade audit trails
If the product grows, the spreadsheet can remain an admin interface or import source, while the system migrates to a real database behind the same API contracts.
That migration path is important: the frontend should depend on the API, not on the spreadsheet.
Recommended Evolution Path
A sensible roadmap looks like this:
- Stage 1: Spreadsheet as database, serverless API, simple frontend.
- Stage 2: Add stronger validation, structured logs, error reporting, and model versioning.
- Stage 3: Add scheduled refresh jobs, notification rules, and backtesting tables.
- Stage 4: Move hot data to a database while keeping spreadsheets for review and manual overrides.
- Stage 5: Introduce event history, audit trails, and role-based access.
This keeps the early system lightweight while leaving room for a more robust backend later.
Summary
This architecture is best understood as a lightweight application stack:
- Spreadsheet: Editable operational database
- Serverless API: Normalization and business logic layer
- Frontend: User-facing interface
The key is not the spreadsheet itself. The key is the contract between layers.
As long as the API returns stable, explainable, normalized data, the system can evolve safely. The spreadsheet can change, the business rules can mature, and the frontend can remain focused on helping users complete the workflow.
For early-stage applications, this is a practical balance: transparent enough to inspect, simple enough to operate, and structured enough to grow.
Related Articles
Schema Sniffer – Structured Data Finder & JSON Extractor
November 8, 2025
UI Components: Building Blocks of User Interfaces
April 21, 2025

3 column flexbox with tabbed content
March 5, 2024